Web Page Infographic Creation
Here is how to make an infographic quickly — even if you are a klutz with image-creation software.
That's me.
You see, I know CSS and HTML and can make them sing and dance for me. But when it comes to image software, I tend to get overwhelmed with all the menu options and dialog boxes when I'm trying to find a feature I'm uncertain even exists.
If, like me, you are less than adept with image software, this article is written especially for you.
The method described here uses CSS and HTML. And your browser's screenshot feature.
If you wish, you can see how well it works to use your document page processor (like Word, Page, or OpenOffice) for creating the inforgraphic. Then export the document to HTML.
Make a web page designed how you want your infographic to look. Then take a screenshot of the web page. Just like that, you have an infographic.
If your infographic is larger than what fits in your browser window, you may need to use Firefox to make the screenshot. Firefox is the only one of several browsers I use that (as of this writing) easily can make screenshots of the entire page, including the parts that extend past the browser viewing window. In other words, even if your browser has scrollbars showing, Firefox can still make a screenshot of the entire web page.
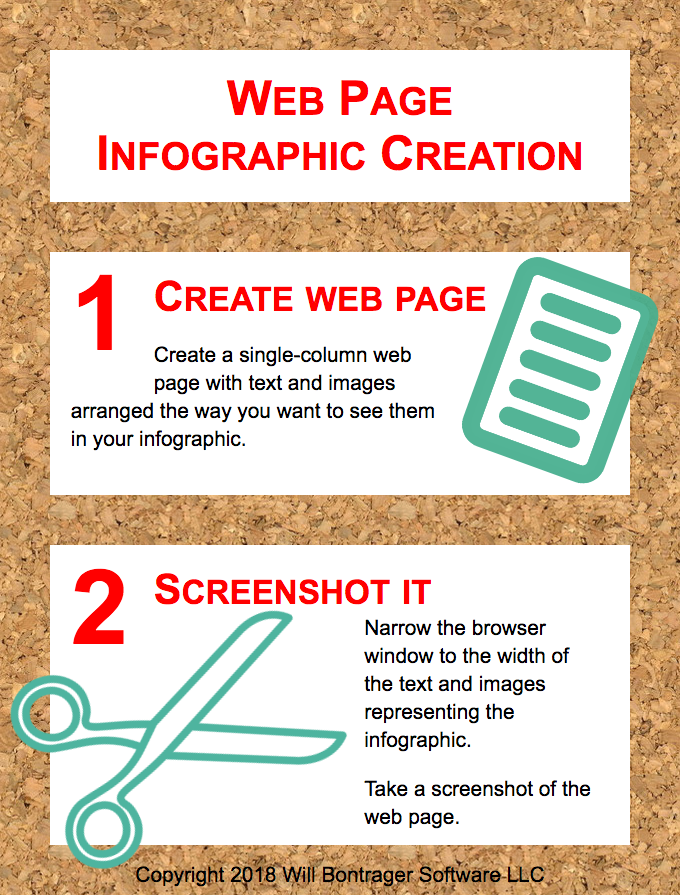
Here is an infographic made for this article.

The infographic is a visual to illustrate and to help remember. It doesn't provide all the details.
So let's look at the process.
Step 1
This is the most fun of the two steps. At least for me because I thoroughly enjoy using CSS and HTML.
What you do is create a web page with a single column bounded with a div. The div has a width, whatever width you want for your infographic.
The div may be given a background color or image.
You may create whatever you want in that div for your infographic, whatever works on a web page except things that move or update. This is intended for a graphic, and graphics don't (generally) update themselves.
Text, bordered boxes, images — any static web page element — may be used to create the infographic.
Make the infographic web page so it looks good in your browser. Just that one browser. Even though the web page might not look the same in other browsers, realize it is not for other browsers, it's for a screenshot. The page doesn't even have to validate — nobody else is going to see it as a web page.
All the web page has to do is display the infographic the way you want it to look, in the browser you're using, so you can take a screenshot of it.
I developed this article's infographic using Firefox browser on Mac OS X.
Here is the web page source code for the example infographic. Copy it, tweak it, use it for learning or as a base for your own infographic.
<!DOCTYPE html>
<html>
<head>
<meta http-equiv="Content-Type" content="text/html;charset=utf-8">
<style type="text/css">
body { margin:0; padding:0; font-size:130%; font-family:arial; }
p, div { font-size:1em; line-height:135%; box-sizing:border-box; }
div > :first-child { margin-top:0; }
div > :last-child { margin-bottom:0; }
h1 { font-size: 2.3em; text-align:center; color:#f00; font-variant:small-caps; line-height: 115%; }
h2 { margin:0; font-size: 2em; text-align:left; color:#f00; font-variant:small-caps; line-height: 115%; }
.nowrap { white-space:nowrap; }
.textdiv { background-color:white; padding:1em; }
.textdivspacing { height:50px; background-color:transparent; }
.stepnumber { float:left; font-size:5em; color:#f00; font-weight:bold; position:relative; top:-10px; line-height:100%; margin-right:25px; }
#content { position:relative; width:680px; overflow:hidden; background:url(https://www.willmaster.com/possibilities/images/corkbackground.jpg); padding:50px; }
/* Background from http://www.photoshopbuzz.com/free-cork-repeating-background/ */
</style>
</head>
<body>
<div id="content">

<div class="textdiv">
<h1>Web Page<br>Infographic Creation</h1>
</div>

<div class="textdivspacing"></div>

<div class="textdiv">
<div class="stepnumber">1</div>
<h2>Create web page</h2>
<div style="float:right; transform:rotate(20deg); position:relative; top:-50px; right:-25px;">
<img src="https://www.willmaster.com/possibilities/images/webpage300x400.png" style="height:200px; width:auto;">
</div>
<p>
Create a single-column web page with text and images arranged the way you want to see them <span class="nowrap">in your</span> infographic.
</p>
<div><!-- For just a twitch of extra space to clear floats without accounting for bottom of rotated object (Firefox browser, Mac OS X). --></div>
</div>

<div class="textdivspacing"></div>

<div class="textdiv" style="height:300px;">
<div class="stepnumber">2</div>
<h2>Screenshot it</h2>
<div style="float:right; width:235px; position:relative; left:-10px;">
<p>
Narrow the browser window to the width of the text and images representing the infographic.
</p>
<p>
Take a screenshot of the <span class="nowrap">web page.</span>
</p>
</div>
<div style="transform:rotate(-25deg); position:relative; left:-65px; top:-95px;">
<img src="https://www.willmaster.com/possibilities/images/scissors300x204.png" style="width:auto; height:auto;">
</div>
</div>

<div style="position:absolute; bottom:6px; left:0; right:0; width:100%; text-align:center;">Copyright 2018 Will Bontrager Software LLC</div>

</div>
</body>
</html>
Step 2
This is simple and quick.
-
Narrow the browser window so the width of the intended infographic shows in the window but no more than that.
-
Use whatever mechanism your browser has to take a screenshot of the entire page.
Save the screenshot and you are good to go.
If you know CSS and HTML, it is possible to make an infographic quickly — without firing up graphics software.
(This article first appeared with an issue of the Possibilities newsletter.)
Will Bontrager


